Cancer Data Science Pulse
ISB-CGC Cloud Resource: Providing Researchers with Shortcuts to Data Analysis
A previous blog introduced NCI’s Cloud Resources and described how these tools put important data into the hands of cancer researchers using cutting-edge cloud technology. As emphasized in that blog, using the cloud eliminates the need to download and store large data sets. Here, we’ll discuss how one of the cloud resources gives researchers a shortcut to accessing and analyzing data via Google BigQuery tables. That cloud resource is the Institute for Systems Biology Cancer Gateway in the Cloud (ISB-CGC)—a collaboration between the ISB and General Dynamics Information Technology Inc., contracted by NCI.
Streamlining the Researcher’s Pipeline
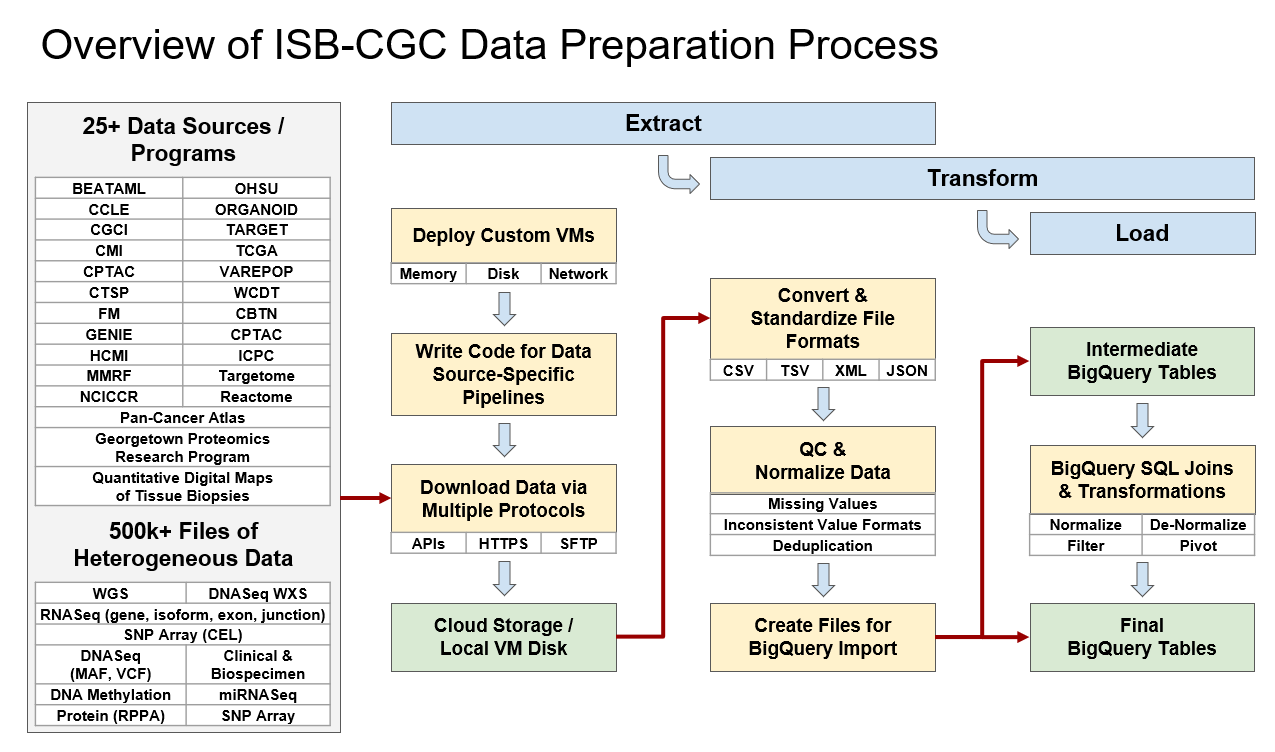
Let’s say that we’re researching mutations on tumors for a specific disease. Data for each patient are stored in separate files. To generate hypotheses and insights, that data must be combined with other patients’ data in hundreds of files. Previously, researchers had to collect, download, and reformat all these files before the data were ready to be explored. Now, ISB-CGC’s extract, transform, and load (ETL) process merges the data from thousands of publicly available NCI molecular level files into Google BigQuery tables so that researchers can immediately take that data and combine them with their own.
ETL is the process of extracting data from primary sources, transforming the data into a usable format, and loading that data into a location where users can access it. In ISB-CGC’s case, much of the hosted data comes from NCI’s Genomic Data Commons (GDC) and Proteomic Data Commons (PDC). ISB-CGC then takes the large volume of source files and consolidates the data by datatype (e.g., Clinical, DNA Methylation, RNA-seq, Somatic Mutation) and transforms those data into permanent ISB-CGC Google BigQuery tables for ease of access and analysis. Because ISB-CGC does this, researchers no longer have to perform this time-consuming part of the data preparation pipeline. See the figure Overview of ISB-CGC Data Preparation Process for a graphical representation of this process.
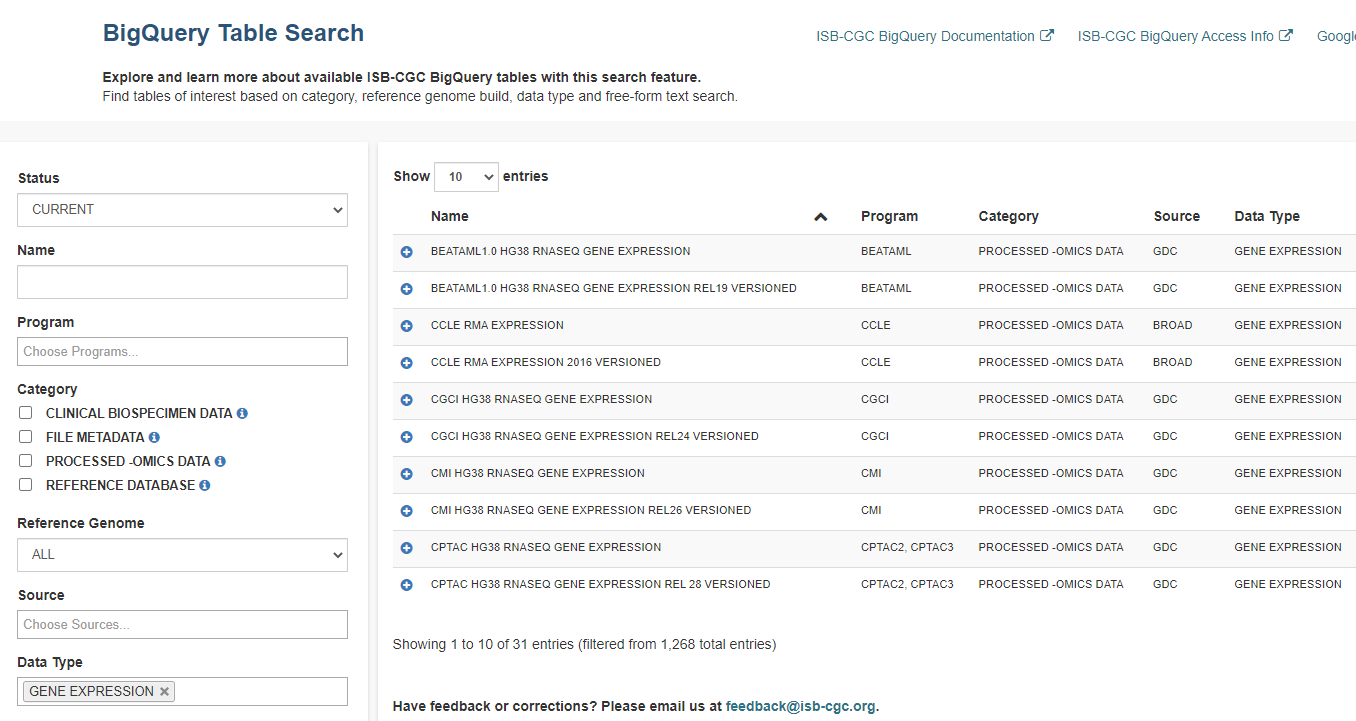
ISB-CGC hosts data from more than 25 research programs in their collection of BigQuery tables. They include programs such as The Cancer Genome Atlas (TCGA), Clinical Proteomic Tumor Analysis Consortium (CPTAC), and Therapeutically Applicable Research to Generate Effective Treatments (TARGET). A list of hosted programs can be found in the ISB-CGC documentation. To find tables of interest, use the ISB-CGC BigQuery Table Search—no login is necessary!
BigQuery—Saving Analysis Time
BigQuery is Google’s cloud data warehouse, and the popular, easy-to-use Structured Query Language (SQL) is used to communicate with it. Using SQL to query ISB-CGC’s curated BigQuery tables enables users to quickly analyze information from thousands of patients. Processing time is extremely fast because BigQuery is built on a massively parallel analytics engine, meaning Google splits the BigQuery data analysis between multiple simultaneous processes as needed. For instance, we were able to compute approximately six billion correlations and their p-values which took about three hours to complete, and the cost was less than two dollars.
Researchers can use SQL directly from the Google BigQuery Console, embed it in Python and R programs, or include it within analysis pipelines. ISB-CGC has many notebook examples of how to use SQL to query BigQuery tables in Python and R.
Exploring Breast Cancer Data Efficiently
Some of our investigators shared how ISB-CGC Google BigQuery tables can be used to process complex statistical methods on multi-omics cancer data, directly in the cloud, in a poster for the 11th Association for Computing Machinery International Conference on Bioinformatics: “Multi-omics data integration in the Cloud: Analysis of Statistically Significant Associations Between Clinical and Molecular Features in Breast Cancer.”
In this study, ISB-CGC members, Drs. Kawther Abdilleh and Boris Aguilar, and Google consultant, J. Ross Thomson, investigated TCGA clinical, genomic, and proteomic data contained in ISB-CGC’s Google BigQuery tables. Using ISB-CGC user-defined functions (i.e., reusable SQL statements that can perform complex operations in the cloud) the investigators took advantage of the high computational power available in Google Cloud to complete their analysis. In this case, the Kruskal-Wallis test was used to determine the statistical associations between TCGA categorical features and protein and RNA expression.
Performing these statistical computations directly in BigQuery was efficient and cost-effective. The study found that, “Significant differences in expression both at the protein and gene expression level are apparent in the CDH1 gene between the two distinct Breast Cancer histological subtypes, infiltrating ductal carcinoma and infiltrating lobular carcinoma.” To view the notebooks used in this work, visit the ISB-CGC Github page. To learn more about ISB-CGC and its work with breast cancer research, read their latest case study.
ISB-CGC would like to help your team find answers to complex questions regarding cancer data. Please reach out to us via email or attend ISB-CGC Office Hours.
Read the other blogs in the series:
Categories
- Data Sharing (66)
- Informatics Tools (42)
- Training (40)
- Precision Medicine (36)
- Data Standards (36)
- Genomics (36)
- Data Commons (34)
- Data Sets (27)
- Machine Learning (25)
- Artificial Intelligence (25)
- Seminar Series (22)
- Leadership Updates (14)
- Imaging (13)
- Policy (10)
- High-Performance Computing (HPC) (9)
- Jobs & Fellowships (7)
- Semantics (6)
- Funding (6)
- Proteomics (5)
- Information Technology (4)
- Awards & Recognition (3)
- Publications (2)
- Request for Information (2)
- Childhood Cancer Data Initiative (1)
Leave a Reply