Cancer Data Science Pulse
Cloud Resources: Cancer Genomics Cloud Helps Power Data Discovery and Analysis to Advance Cancer Research
The exponential growth and continued diversity of complex data sets pose an ongoing challenge for cancer researchers in the data science field. In fact, researchers often point to this hurdle as one reason for avoiding the use of existing data sets for secondary research. Combining different data sets takes significant time and resources. Other obstacles include difficulty discovering, accessing, and sharing data, as well as a lack of computational power.
NCI sought to address these challenges by building the Cancer Research Data Commons (CRDC), a cloud-based ecosystem designed to facilitate the access, analysis, and sharing of cancer data across the cancer research community. The NCI Cloud Resources are an integral part of this ecosystem. These analytic engines help power the CRDC by giving users the computational strength to make meaningful discoveries in cancer research.
One of these engines is the Cancer Genomics Cloud (CGC), developed by Seven Bridges. Allowing researchers to conduct cancer data analysis more efficiently within the cloud-based platform, the CGC pulls together:
- large cancer data sets, such as The Cancer Genome Atlas (TCGA), the Clinical Proteomic Tumor Analysis Consortium (CPTAC), and others;
- more than 600 bioinformatics tools and best-practice multi-omics analysis workflows; and
- the computational capabilities to perform large-scale analyses.
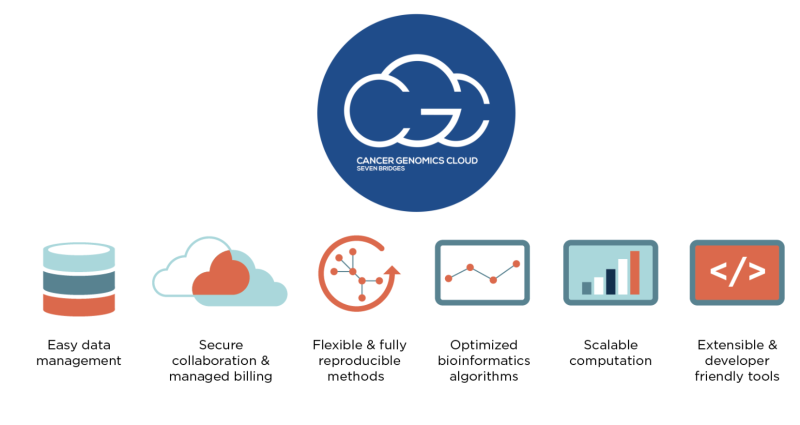
Figure 1: The Cancer Genomics Cloud is a cloud-based platform that brings together access to data, tools, and computational power to improve the ease of analyzing cancer data.
Altogether, the CGC gives researchers immediate access to more than three petabytes of multi-dimensional data.
Built for Functionality
The CGC platform is built for researchers regardless of their cloud computing skills. A user-friendly portal allows researchers to browse, query, and filter data sets. Researchers also can bring their own data to the CGC to combine with publicly available data. The platform can be used with data stored in either the Amazon or Google clouds, so users can run computations in the location where the data “lives,” eliminating the need for downloading large data sets. Each new user receives $300 in credits to try out the cloud capabilities. In addition, users (particularly students and postdocs) can apply for a Collaborative Project proposal for research questions in new and compelling areas for up to $10,000 in credits.
Additionally, the platform is designed to support the latest in security and FAIR (Findable, Accessible, Interoperable, and Reproducible) principles. Services also support other global technical standards, like guidelines recommended by the Global Alliance for Genomics and Health (GA4GH) for data repository services (DRS), whole exome sequencing (WES), and tool repository services (TRS). The platform uses Common Workflow Language (CWL) to port tools to the CGC, allowing users to access and analyze highly-distributed data in a standardized, reproducible, and efficient manner. This CWL functionality also allows users to bring their own analysis tools to the platform and to use them within a private workspace.
Workflows at Your Fingertips
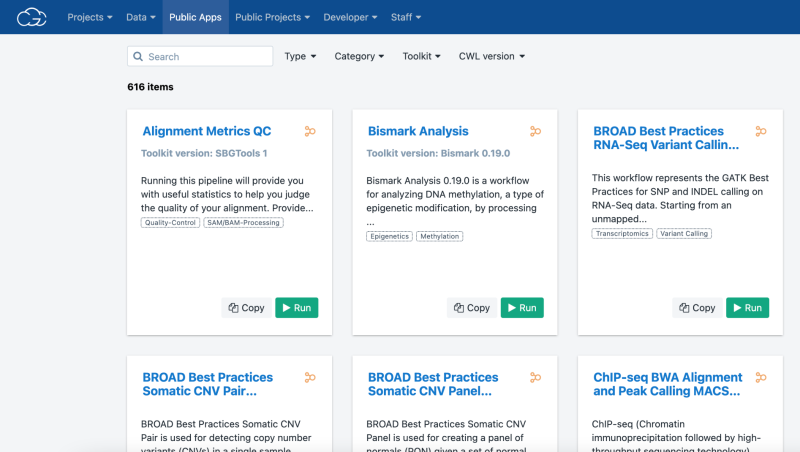
The Public Apps Gallery on the CGC contains hundreds of tools and workflows.
Users seeking common, best-practice analysis methods can find them within the CGC. Its Public Apps Gallery contains hundreds of pre-built tools and workflows that have been cloud-optimized by the Seven Bridges Bioinformatics Team. The Public Apps cover a wide range of research areas, including RNAseq, mutation or variant analysis, single-cell analysis, proteomics, epigenetics, and imaging. Each tool contains detailed explanations and benchmarking data for time and cost estimates. In addition, the Workflow Editor, a tool within the CGC, allows researchers to wrap their custom workflows in CWL to tailor analysis to their exact needs. Other CGC resources include extensive online documentation, training resources, and technical support from a team of more than 200 expert scientists, bioinformaticians, and engineers, to help both new and advanced users alike.
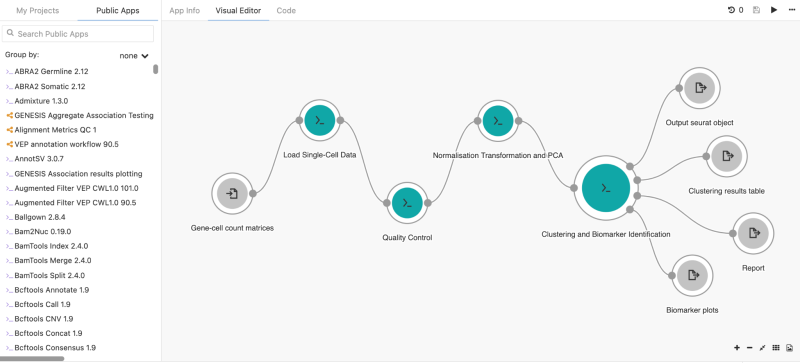
The workflow editor makes it easy to wrap a tool in CWL for portability to the cloud.
CGC Case Report
Since its launch in 2016, the CGC has helped thousands of users in their research. To date, more than 6,000 users have run almost 2 million tasks, adding up to thousands of years in compute time. More recently, the CGC was integrated with data repositories within the CRDC, including the Genomic Data Commons, the Proteomic Data Commons, the Integrated Canine Data Commons, and the General Commons (formerly known as the Cancer Data Service), to support research questions that have become increasingly multi-omic. Researchers can examine multiple data types side-by-side, enabling new insights into cancer progression.
As one example, McKerrow and colleagues at New York University recently examined the role of long interspersed nuclear element-1 (LINE-1), an important driver and diagnostic marker of disease, and its connection to cancer progression. Through the CGC’s cloud-based access to data and computation, the investigators were able to examine the DNA, RNA, and protein expression profiles of corresponding samples in both the TGCA and CPTAC. As a result, they were able to show a correlation between LINE-1 activity and tumor progression in multiple tumor types.
Many researchers have also used the CGC to develop and distribute new tools and methodologies. A recent paper, published by Julia Salzman’s lab at Stanford University, showcases a new algorithm for examining how regions of genes (splice junctions) are excised out of the primary RNA transcript prior to synthesis of the specific protein. Using single-cell data from the CGC, the authors developed a new method that assigns statistical confidence to splice junctions from a spliced aligner to improve precision in single-cell sequencing. Their work demonstrated that the SICILIAN (SIngle Cell precIse spLice estImAtioN) method improves splice junction detection and is applicable to several data types. SICILIAN also helped reveal new regulated splicing patterns in primary human and non-human samples that weren’t evident using previous methodologies.
These are just two ways the platform is being used to promote research into the genes underlying cancer. For additional information on the CGC and these case reports, see the citations below:
- Lau JW, Lehnert E, Sethi A, Malhotra R, Kaushik G, Onder Z, Groves-Kirkby N, Mihajlovic A, DiGiovanna J, Srdic M, Bajcic D, Radenkovic J, Mladenovic V, Krstanovic D, Arsenijevic V, Klisic D, Mitrovic M, Bogicevic I, Kural D, Davis-Dusenbery B; Seven Bridges CGC Team. The Cancer Genomics Cloud: Collaborative, Reproducible, and Democratized-A New Paradigm in Large-Scale Computational Research. Cancer Res. 2017 Nov 1;77(21):e3-e6. doi: 10.1158/0008-5472.CAN-17-0387.
- McKerrow W, Wang X, Mita P, Cao S, Grivainis M, Ding L, LaCava J, Boeke J, Fenyö D, LINE-1 expression in cancer correlates with DNA damage response, copy number variation, and cell cycle progression. Preprint. bioRxiv 2020.06.26.174052; doi: https://doi.org/10.1101/2020.06.26.174052
- Dehghannasiri R, Freeman DE, Jordanski M, Hsieh GL, Damljanovic A, Lehnert E, Salzman J. Improved detection of gene fusions by applying statistical methods reveals oncogenic RNA cancer drivers. Proc Natl Acad Sci U S A. 2019 Jul 30;116(31):15524-15533. doi: 10.1073/pnas.1900391116. Epub 2019 Jul 15. PMID: 31308241; PMCID: PMC6681709.
Read the other blogs in the series:
Leave a Reply
Categories
- Data Sharing (66)
- Informatics Tools (42)
- Training (40)
- Precision Medicine (36)
- Data Standards (36)
- Genomics (36)
- Data Commons (34)
- Data Sets (27)
- Machine Learning (25)
- Artificial Intelligence (25)
- Seminar Series (22)
- Leadership Updates (14)
- Imaging (13)
- Policy (10)
- High-Performance Computing (HPC) (9)
- Jobs & Fellowships (7)
- Semantics (6)
- Funding (6)
- Proteomics (5)
- Information Technology (4)
- Awards & Recognition (3)
- Publications (2)
- Request for Information (2)
- Childhood Cancer Data Initiative (1)
Hosein Fallah on November 19, 2021 at 02:54 p.m.
Sincerely.