Cancer Data Science Pulse
How the Mitelman Database Can Help You Explore Genomic Abnormalities
A previous blog discussed how one of NCI’s Cloud Resources, the Institute for Systems Biology Cancer Gateway in the Cloud (ISB-CGC), provides researchers with shortcuts to data analysis by making important clinical, genomic, and proteomic data available in Google BigQuery tables.
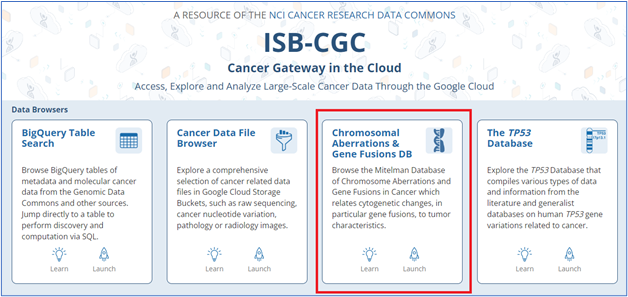
ISB-CGC is also home to some standalone databases of genomic importance. Today, we highlight one of these—the Mitelman Database of Chromosome Aberrations and Gene Fusions in Cancer and the recent addition of genomic coordinates to its user interface.
The Mitelman Database: A Goldmine of Cytogenetic Data Linked to Cancer
Cytogenetic analysis is the process of examining chromosomes, especially to look for abnormalities such as missing, extra, broken, or rearranged chromosomes. When applied to tumors, cytogenetic analysis can provide crucial information about the genetic mechanisms of cancer.
The Mitelman Database of Chromosome Aberrations and Gene Fusions in Cancer catalogs over 70,000 such acquired chromosome aberrations for multiple types of cancer. The database relates cytogenetic aberrations and their genomic consequences, in particular gene fusions, to tumor characteristics. The information has served the research community for decades, but only recently has lived online:
- 1983: Began as a book
- 2000: NCI made the information available online
- 2019: ISB-CGC began hosting and supporting the database on its cloud platform
Dr. Felix Mitelman, in collaboration with Drs. Bertil Johansson and Fredrik Mertens, manually culled all the data from the literature. NCI, the Swedish Cancer Society, and the Swedish Childhood Cancer Foundation support the Mitelman Database. These organizations update the database quarterly in January, April, July, and October.
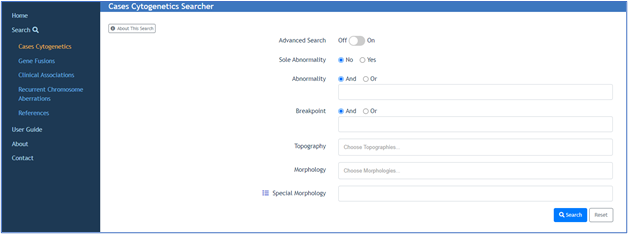
You can query the database by parameters such as topography, morphology, gene characteristics, cytogenetic aberrations, and journal references.
Adding Genomic Coordinates Increases Data Collaboration Opportunities
Until recently, the database only displayed the resulting genetic location information in karyotypes ; this tells where a gene is by referencing its physical location on a band of the arm of a human chromosome.
Nowadays, much genomic research data describes gene locations in molecular terms instead of physical location; that is, by using precise nucleotide start and stop positions on the chromosome. Though the karyotype data in the Mitelman Database has been very useful, mapping it to molecular genomic coordinates increases the range of research data that it can be combined with to make significant scientific discoveries.
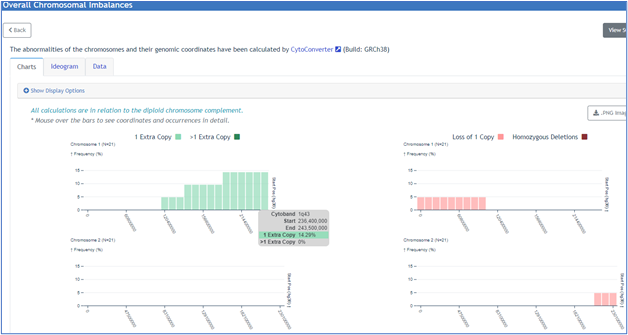
As of June 2022, the Mitelman Database also displays genomic coordinates on the user interface. Thanks to procedures incorporated from the web-based tool CytoConverter, you can view the genomic coordinates translated from the chromosomal imbalances identified in the karyotype nomenclature.
You have the option of viewing the genomic coordinate information for either individual karyotypes or for multiple karyotypes in a search result providing the following information:
- Corresponding chromosome
- Start and end position
- Type of imbalance (i.e., gain or loss). For multiple chromosomes, net imbalances across the selected group are displayed in chart, ideogram, or tabular format.
Mitelman Data on the Cloud
Like the rest of the data that ISB-CGC hosts, the Mitelman data, including the CytoConverter-generated genomic coordinates, are also publicly available in Google BigQuery, a cloud-based data warehouse formatted in data matrices. This allows researchers to analyze the data using Structured Query Language (SQL) and tools such as Python and R and to combine the data with other data sets. The ISB-CGC team has provided examples on Github, which researchers can use as templates for their own data exploration.
Categories
- Data Sharing (66)
- Informatics Tools (42)
- Training (40)
- Precision Medicine (36)
- Data Standards (36)
- Genomics (36)
- Data Commons (34)
- Data Sets (27)
- Machine Learning (25)
- Artificial Intelligence (25)
- Seminar Series (22)
- Leadership Updates (14)
- Imaging (13)
- Policy (10)
- High-Performance Computing (HPC) (9)
- Jobs & Fellowships (7)
- Semantics (6)
- Funding (6)
- Proteomics (5)
- Information Technology (4)
- Awards & Recognition (3)
- Publications (2)
- Request for Information (2)
- Childhood Cancer Data Initiative (1)
Leave a Reply