Cancer Data Science Pulse
Visualizing Genetic Mutations in Three-Dimensions—Pro-Tips From a Structural Biology Perspective
CBIIT’s series on data visualizations continues with a look at visualizing genetic data in a three-dimensional (3D) format. Here, Dr. Michael Sierk, a contractor with Essential Software, Inc., and Dr. Daoud Meerzaman from CBIIT’s Computational Genomics and Bioinformatics Branch, show how they create visualizations in 3D using a new tool called 3DVizSNP.
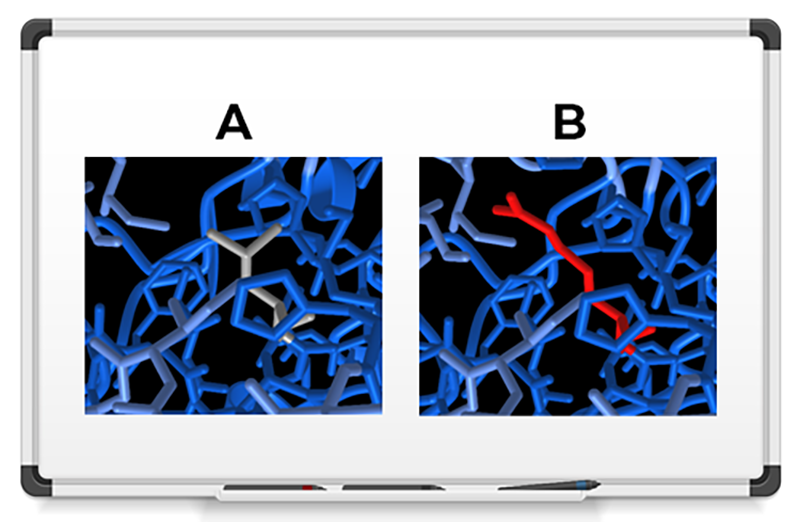
We used 3DVizSNP to sort and prioritize variants according to their 3D structural information. Using data from The Cancer Genome Atlas Program (TCGA), we filtered a list of 27,526 variants to identify mutations that were most likely to be damaging. We then fed those 901 resulting variants into the 3DVizSNP tool. We identified a mutation in a Cytochrome P450 protein (the AlphaFold2 structure prediction is shown above), which helps protect against cancer. The mutation changes a neutral leucine amino acid (A) to a charged arginine (B), and results in a destabilized version of the protein.
What type of graphic is it?
We made these images using 3DVizSNP, which allows you to explore mutations of a single amino acid (i.e., single nucleotide polymorphisms or SNPs) in a 3D format.
Why is the graphic important?
Viewing mutations within a 3D context of the full protein gives you essential information. You can actually see areas that drive the mutations associated with diseases such as cancer.
You start with a simple text file, which maps onto a known protein structure (i.e., structures that have been determined experimentally through techniques such as X-ray crystallography or computationally through artificial intelligence programs, such as AlphaFold). Using this visualization, you can search for mutations that could be important in driving or sustaining cancer.
Unfortunately, because most biologists aren’t trained in structural biology, figuring out where a mutation maps to a protein or which experimental or computational structures are available can be time consuming. This makes it difficult to view mutations in some 3D programs.
With the 3DVizSNP tool, we’re able to automate this process. You can quickly see the mutations in proteins and prioritize them for further study. The program also allows you to toggle back-and-forth between a “wildtype” string of amino acids (i.e., one that is unchanged) and a mutant string (which shows a change), so you can directly visualize the mutation’s effect.
How does it work?
Our team created the tool in Python, but you don’t need programming experience to use it. The program runs locally without installing any additional software or databases. We partnered with CBIIT’s Digital Services and Solutions Branch to make the tool available to others online. You can access 3DVizSNP on this website.
You begin by uploading a variant caller format (VCF) file. After a few minutes, the results appear in a table, and the selected mutation shows in a structure viewer embedded at the top of the webpage. The table, which you can sort and filter, includes the gene ID, protein ID, structure ID, and predictions about how damaging the mutant is. You can download the results as a comma-separated file (i.e., csv) for loading into Excel.
You’ll find options for coloring and depicting the structures. You also can see what happens to nearby amino acids when a certain mutation occurs. For example, the wild-type amino acid might form a hydrogen bond to a neighboring amino acid whereas the mutant form does not, so you can see immediately that the mutation broke this important bond.
This fully interactive program bridges the gap between genetics and structural biology so you can quickly visualize mutations. A web-based 3D viewer, called iCn3D, written by Dr. Jiyao Wang at the National Center for Biotechnology Information, is the basis for 3DVizSNP.
This short movie shows how a glutamine-to-proline mutation breaks a stabilizing hydrogen bond in the DNA regulatory protein BRD4, which is a therapeutic target for leukemia. The hydrogen bond, which connects a glutamine sidechain to a neighboring amino acid, appears here in a portion of the AlphaFold2 model of UniProt ID O60885 (green dashed line). The bond breaks when the amino acid mutates to the cyclic amino acid proline.
What should I consider when visualizing these kinds of data?
Many factors go into assessing the potential impact of a mutation, and interpreting 3D data can be complex. Structural details are often very subtle and may not be apparent to novices. With some practice, you can become comfortable with the program’s interface and more adept at spotting these changes. The application features numerous tools to provide insight into the protein’s function and any mutations but takes time to learn. 3DVizSNP can make it easier to sort and filter your mutations, but you will need to do further computational and experimental analysis to derive the full results.
What’s your favorite visualization and why?
It’s really hard to pick a favorite. But we both are drawn to 3D visualizations, because you can see so many details. AlphaFold and related programs have ushered in a new era in structural biology, giving us a way to make accurate computational predictions for millions of protein structures. Today, we can combine experimental technologies with computing power and sophisticated software and generate vast amounts of cancer research data.
We’ve made fantastic progress, both in understanding the disease and treating it. Still, we need more effective ways to visualize all those data to make the best use of that information. By offering 3DVizSNP to visualize data in 3D, we’re hoping to help researchers wade through the vast sea of data and drive new discoveries.
Categories
- Data Sharing (66)
- Informatics Tools (42)
- Training (40)
- Precision Medicine (36)
- Data Standards (36)
- Genomics (36)
- Data Commons (34)
- Data Sets (27)
- Machine Learning (25)
- Artificial Intelligence (25)
- Seminar Series (22)
- Leadership Updates (14)
- Imaging (13)
- Policy (10)
- High-Performance Computing (HPC) (9)
- Jobs & Fellowships (7)
- Semantics (6)
- Funding (6)
- Proteomics (5)
- Information Technology (4)
- Awards & Recognition (3)
- Publications (2)
- Request for Information (2)
- Childhood Cancer Data Initiative (1)
Leave a Reply