Cancer Data Science Pulse
For the Love of . . . Data! Dr. Sharpless Shares His Story
At NCI’s Center for Biomedical Informatics and Information Technology (CBIIT), our love for data runs deep. Here, in celebration of NCI’s 50th anniversary and recognizing the Power of Data, we asked NCI and CBIIT staff to tell us what data means to them and to the field of cancer research. This is the first in the series, “For the Love of…Data!” Fittingly, we asked Dr. Ned Sharpless to lead us off as we pay tribute to our love of data!
What made you fall in love with data?
Between my second and third year of med school, I took about a year off to work at NIH in the Howard Hughes Medical Institute-NIH Scholars program. I worked in a lab on campus where I used a cell culture model to study HIV infection in the brain.
In one of the experiments, I added live virus to cultured human brain cells and then harvested and froze the media aliquots from the cultures daily over the course of the week. Then I’d take all the aliquots collected from multiple experiments and, in a single day, do an analysis on each one to find the amount of viral protein in the media at each timepoint post-inoculation.
The purpose of the research was to identify which viral strain isolates were able to productively infect the brain, as well as the specific brain cells that were infected. So each experiment would have many different conditions, timepoints, and replicates; and, because I did all the assays in batch, I would get protein levels from hundreds of aliquots all at once.
Then, by hand using graph paper, I would “crack the code,” matching the viral protein level for each numbered aliquot with the record of when and how that aliquot was collected.
It was like magic. Some of the viral strains showed high levels of viral protein in the media within a few days of inoculation, and other strains didn’t. We called the brain-infecting strains “neurotropic” and eventually proved they were infecting microglia in the cultures.
I remember how wonderful it was when I got those protein level results. Even though the strains were analyzed in near random order from the aliquots, the viral protein levels would be high or low in just the right way, according to the experimental condition. This made me appreciate that data could be really powerful and teach you things you didn’t expect.
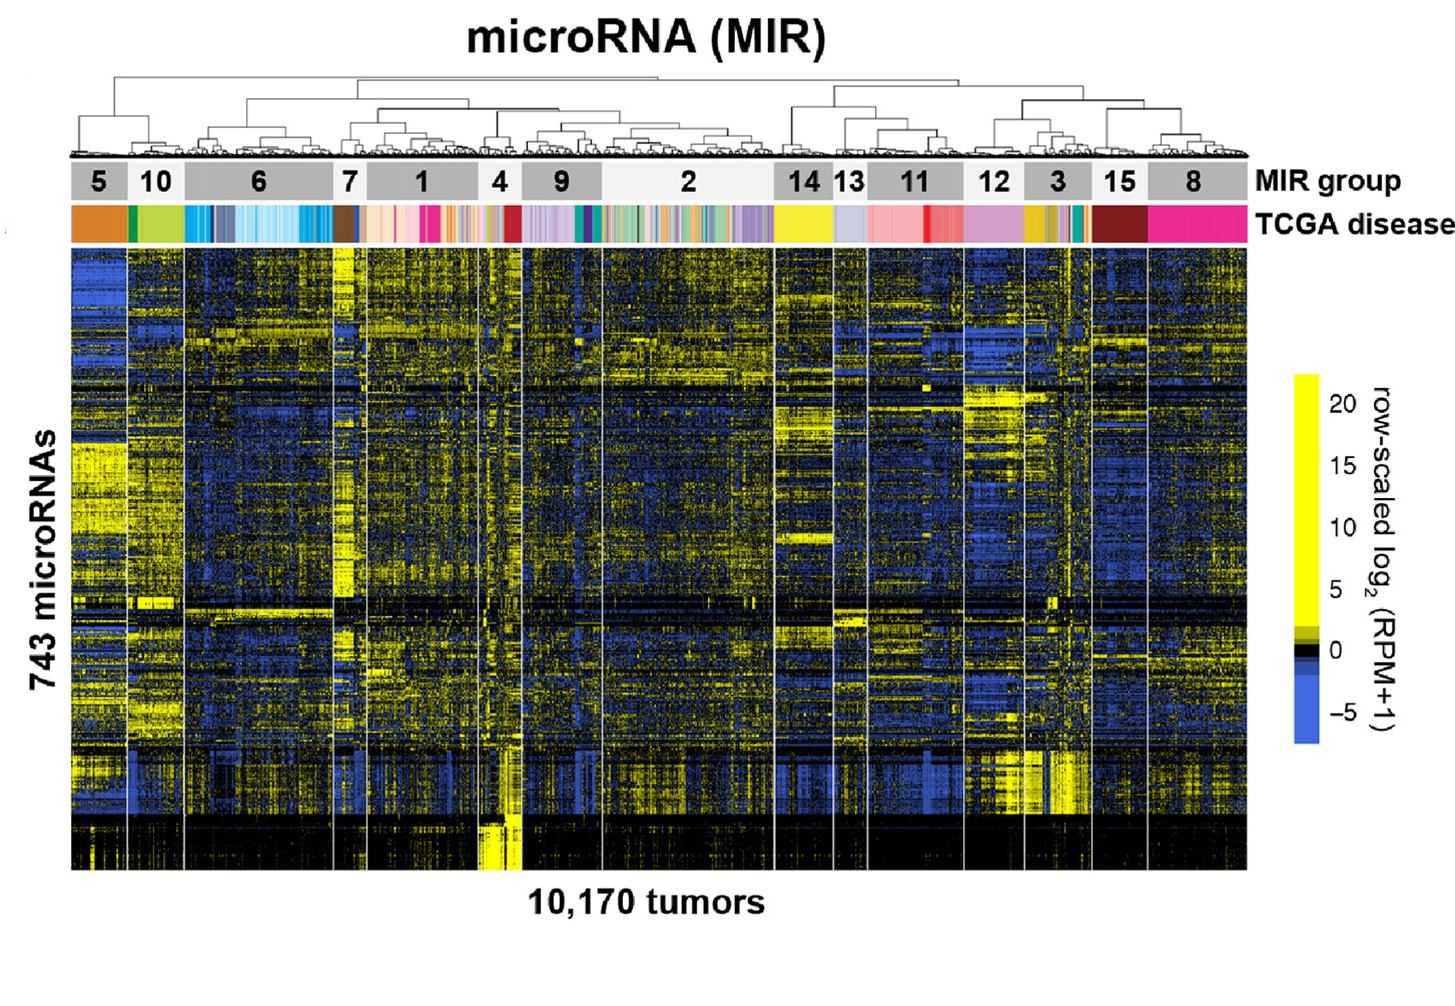
Today, scientists can examine data “heat maps,” which show genetic activity profiles from thousands of tumors at one time. This one shows MicroRNAs, a class of non-coding RNAs that are important for regulating gene expression.
What do you think has been the single greatest accomplishment in data science over the past 50 years of cancer research?
It’s hard to say what has been the greatest accomplishment, but I do know what has really transformed the field of cancer data science: RNA transcriptomics.
Prior to RNA transcriptional analysis, it was possible to be a cancer data scientist and have only a modest understanding of statistics, while working with Excel on a 1990s desktop computer. Post-RNA expression profiling, everything got much harder. We had to learn (or re-learn) complex data visualization (e.g., heat maps), dimensionality reduction (e.g., PCA), and use much more sophisticated statistics. We also moved analysis from our desktops to the University server (or the cloud). We quickly went from working with one megabyte of data to petabytes.
As NCI embarks on the next 50 years, can you offer any practical tips or advice that should be considered?
The only constant is change. Cancer data science is moving so fast. There’s no time to get too attached to any specific research approach or methodology. How we analyze data today, and the type of data we analyze today, will be very different in just a few years. So be flexible and stay prepared for what comes next.
Leave a Reply
Categories
- Data Sharing (66)
- Informatics Tools (42)
- Training (40)
- Precision Medicine (36)
- Data Standards (36)
- Genomics (36)
- Data Commons (34)
- Data Sets (27)
- Machine Learning (25)
- Artificial Intelligence (25)
- Seminar Series (22)
- Leadership Updates (14)
- Imaging (13)
- Policy (10)
- High-Performance Computing (HPC) (9)
- Jobs & Fellowships (7)
- Semantics (6)
- Funding (6)
- Proteomics (5)
- Information Technology (4)
- Awards & Recognition (3)
- Publications (2)
- Request for Information (2)
- Childhood Cancer Data Initiative (1)
Robert Martin on June 12, 2021 at 07:01 a.m.