Cancer Data Science Pulse
COVID-19 SeroHub—Pressing an Existing NCI Infrastructure Into New Service
When COVID-19 first gained a foothold and started to spread rapidly across the United States in 2019–2020, we needed a way to track the progression of the virus to help combat it.
Seroprevalence studies assess the prevalence of the population with antibodies to Severe Acute Respiratory Syndrome Coronavirus 2 (SARS-CoV-2) and are particularly useful for tracking the spread of the virus across a population over time. Because of their utility, numerous seroprevalence studies have been conducted, both in the United States and worldwide, and they’re yielding valuable data.
There are some challenges to such large-scale prevalence tracking, however. Studies often vary widely in their design and may use different serology assays. They’re conducted in different geographic regions, age groups, and population groups. For example, studies have been conducted among blood donors, first responders, health care workers, and soldiers. Studies also enroll participants at different times and thus reflect different events during the pandemic, such as the emergence of new variants and widespread vaccination.
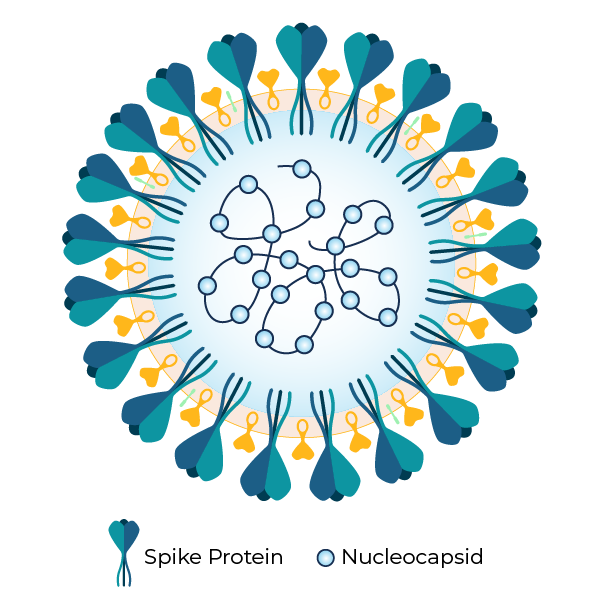
Despite these challenges, seroprevalence studies can be used to track both SARS-CoV-2 infections and vaccinations. Corona virus—with its unique shape—is named for its “crown-like” structure. It has two distinct parts—the distinctive spike protein and the nucleocapsid protein. (See figure, on right.)
Seroprevalence studies typically test for antibodies directed at one of these two parts of the virus, either the spike or the nucleocapsid. This is significant, because the vaccines used in the United States target the spike protein. As a result, seroprevalence studies can be used to examine both infection-induced seropositivity as well as vaccine-induced seropositivity. This differentiation is particularly useful in monitoring the impact of vaccination on the continuing pandemic at the regional and national levels.
The usefulness of seroprevalence tracking underscores the need for a real-time repository to collect and standardize data from the full range of studies being conducted.
Fortunately, NCI already had a mechanism in place that could be quickly pressed into service. We leveraged the infrastructure and expertise from NCI’s Clinical Trials Reporting Program (CTRP), an extensive online database that serves as a one-stop repository for information on all NCI-supported clinical trials.
COVID-19 SeroHub
Building on the success of CTRP, the Frederick National Laboratory for Cancer Research (FNLCR) Biomedical Application Development Center, along with the Centers for Disease Control and Prevention and the National Institute of Allergy and Infectious Diseases, developed the COVID-19 Seroprevalence Hub or SeroHub.
SeroHub serves as a central repository for studies on SARS-CoV-2 examining seroprevalence. It includes an interactive dashboard that allows researchers and policymakers to monitor seroprevalence studies conducted across the United States over time.
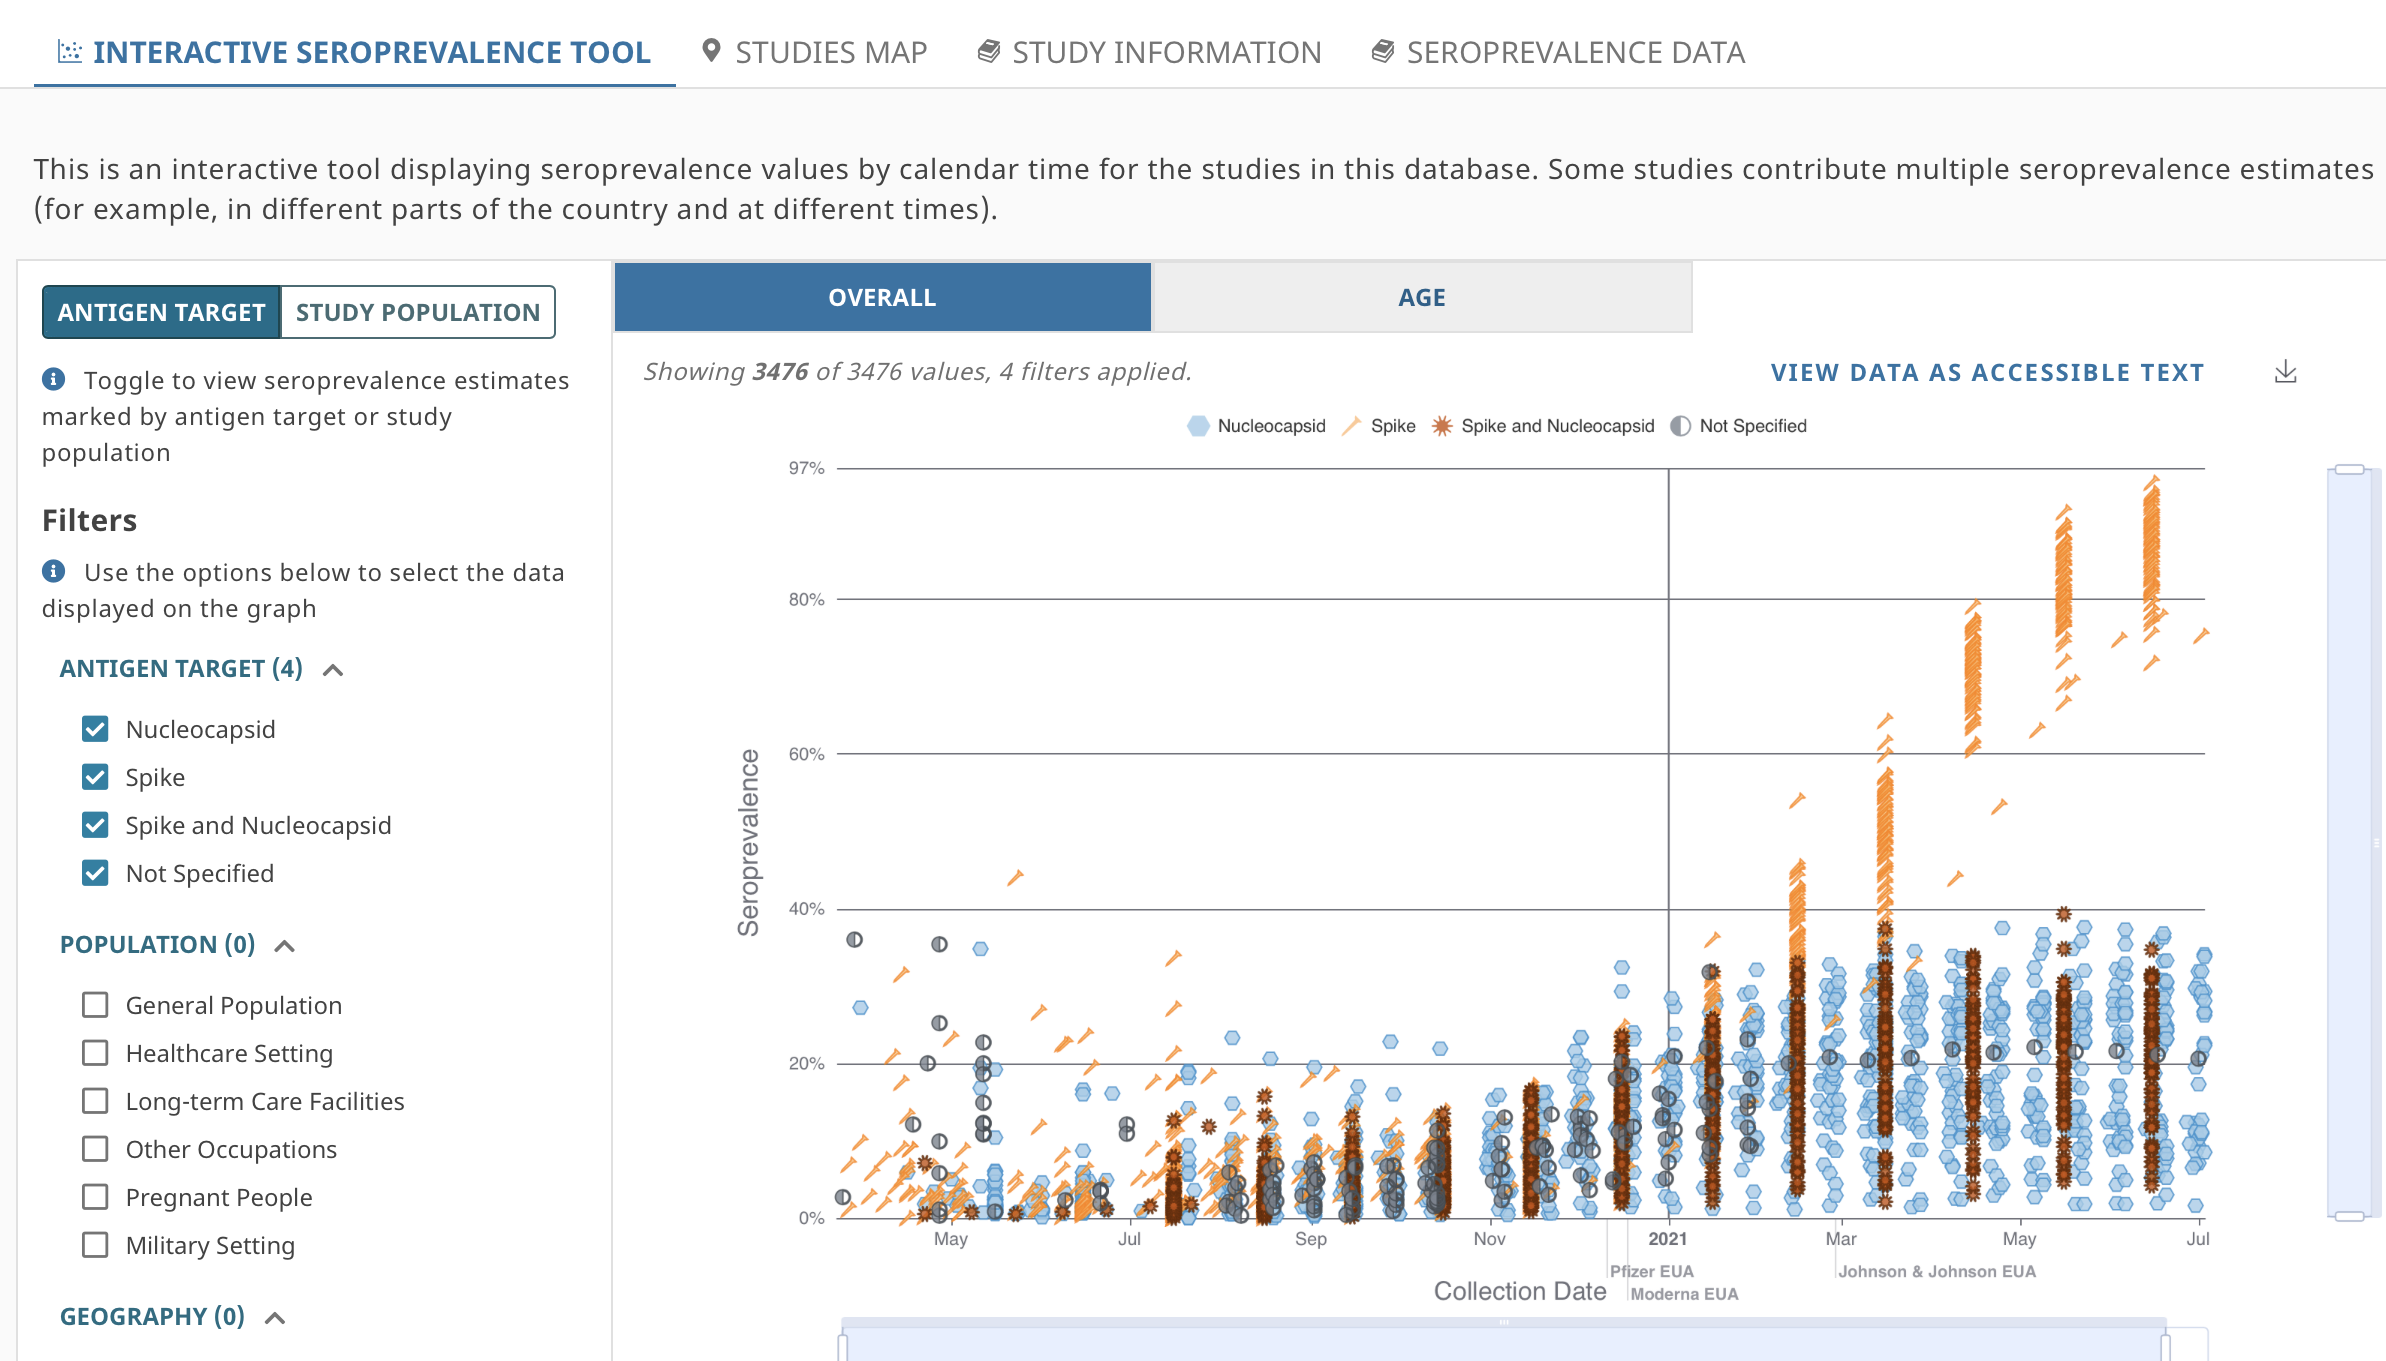
Through SeroHub’s interactive tool, users can track changes in COVID-19 seroprevalence at different times and by geographic location, age, sex, and race/ethnicity. Filters allow users to select specific serology test characteristics, such as the target antigen (nucleocapsid and/or spike antigen). Population filters also are in place, allowing users to view findings from the general population, healthcare settings, and long-term care facilities. Other filters allow users to sort by people who are pregnant or those serving in the military. Results are displayed as an interactive chart or in an accessible full-text table (See figure showing the interactive chart).
Key findings include substantial ongoing differences across tested populations, from the start of the pandemic to present day. For example, our most recent data are from two large CDC-led studies.
In the Nationwide Blood Donor Seroprevalence Survey, which captures data from participants donating blood, estimates of seroprevalence show significant regional differences. In December 2021, infection-induced (nucleocapsid and spike based) seropositivity estimates ranged from 10% in regions such as Hawaii and Vermont, compared with 57.6% in the Southeastern Texas region. Seroprevalence to the spike alone, indicating either infection-induced or vaccine-induced seropositivity, ranged from 89.7% in the South Dakota region to 98.9% in the Southeastern Texas region.
The Nationwide Commercial Laboratory Seroprevalence study partially captures the impact of the omicron wave using data from January 2022. In these data, the prevalence of nucleocapsid showed broad distribution, from 17.8% in Vermont to 56.1% in Wisconsin.
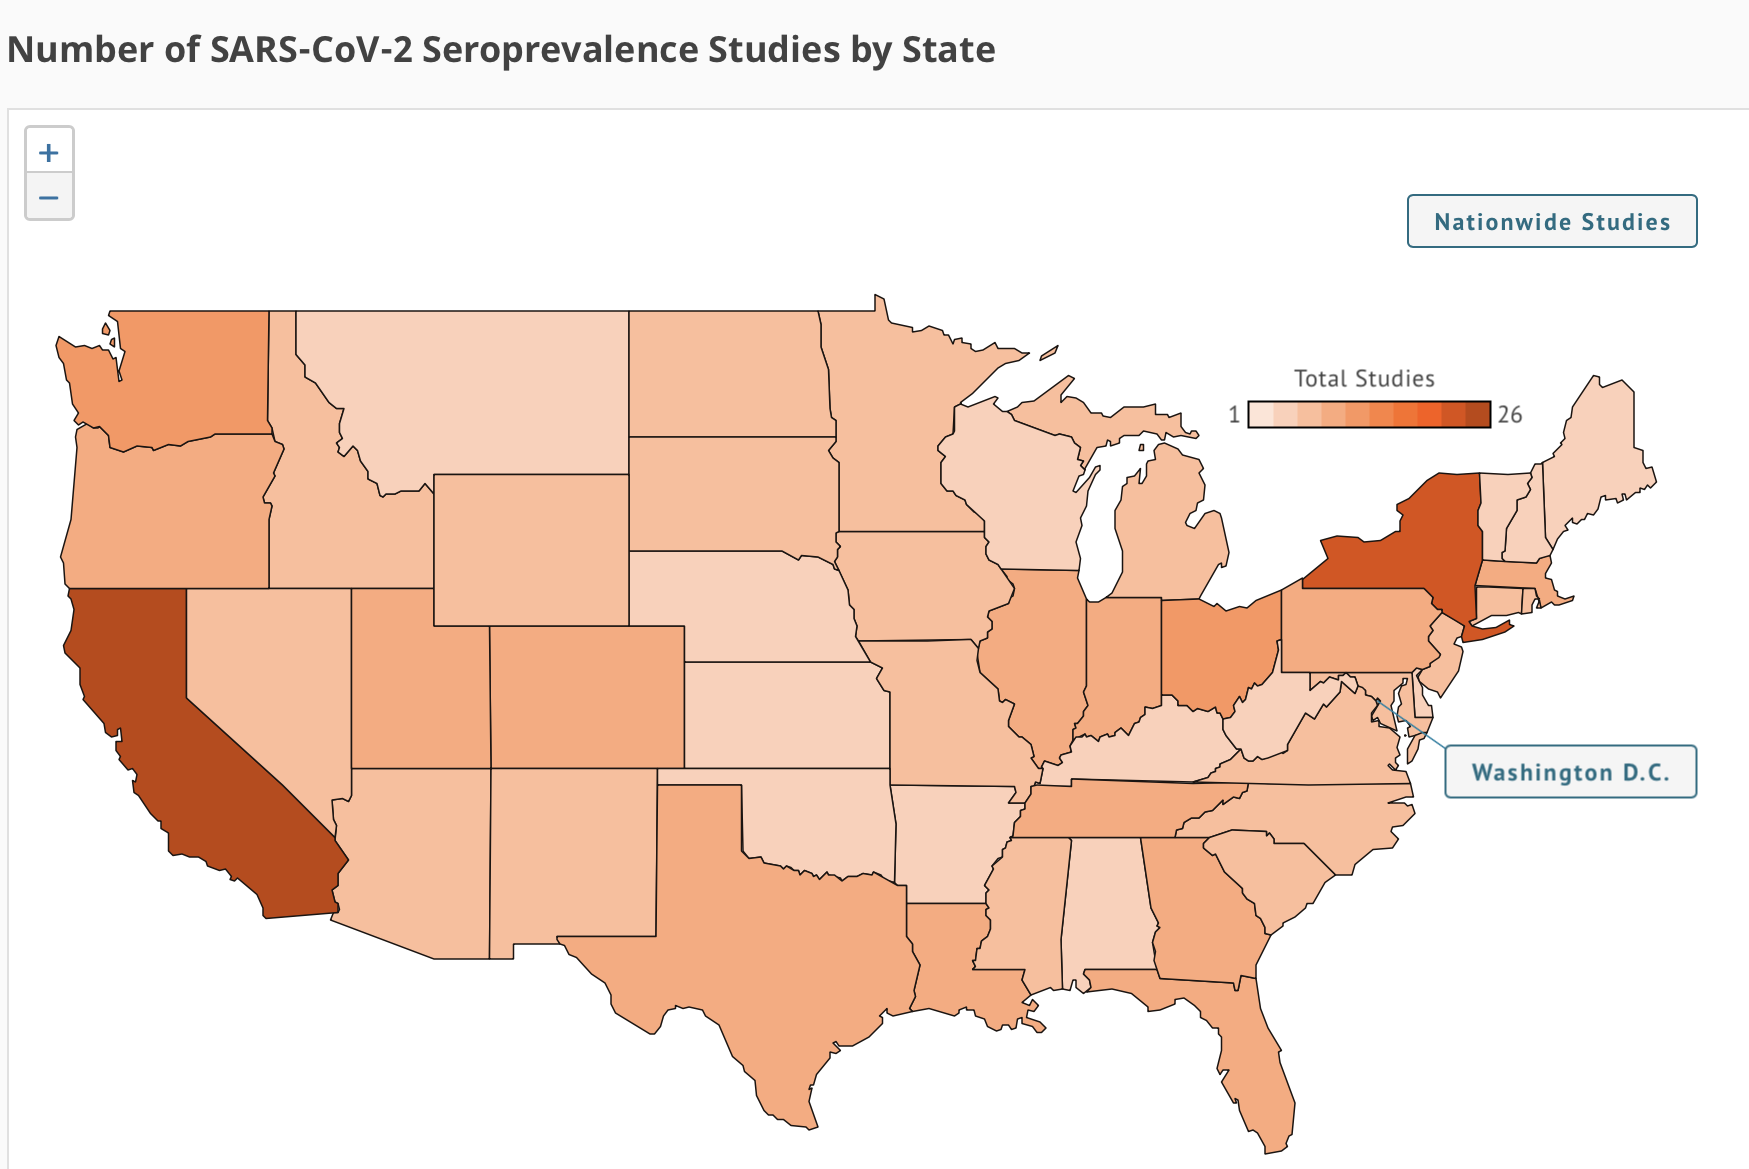
Users also can switch to a full-map view of the United States to see the number of studies that have been conducted in each state and learn more about each one. (See figure, on right.)
Digging Deeper
Researchers and others looking for a more in-depth examination of these studies have additional options beyond the interactive tool.
We have created specific pages for each study, with links to associated publications and websites. Furthermore, seroprevalence data are available for download and can be sorted in several ways, including by:
- Population
- Geography (state and/or nationwide)
- Report type (preprint or peer-reviewed publication)
- Special collections (i.e., as part of a nationwide blood donor survey)
- Test type (e.g., Enzyme-Linked Immunosorbent Assay or Chemiluminescence Immunoassay, etc.)
- Antigen target (e.g., spike or nucleocapsid proteins)
- Antibody isotypes (IgG/IgM, only IgG or IgM, or PanIg)
The data are aggregated and can be downloaded as a Microsoft Excel spreadsheet or accessed by an application programming interface (API).
The Process
Our team at SeroHub welcomes the submission of both in-process and completed studies from all sources, including academic institutions, private industry, and public health entities. All studies captured in SeroHub must meet certain basic criteria. Studies will be excluded if they are outbreak investigations (e.g., a single site, transmission chain, small population, etc.); related to general serological sciences, not COVID-19 specific; based outside the United States; used in assay development efforts; or which do not specifically report seroprevalence estimates.
Researchers can submit their studies to SeroHub using the template available on the website. This form captures all the necessary details, including study name, authors, funding information, methodology, findings, and more.
In addition to accepting submitted studies, the SeroHub team has developed a standard operating procedure for scouring websites, abstracting content, and uploading new data. (See website for details on this process.)
Once studies are collected and validated, the data and their accompanying metadata are structured as JavaScript Object Notation (JSON) files to make the information readily available. JSON files are the standard data exchange format for an Extract, Transform, and Load (ETL) pipeline built using Amazon Web services Lambda (Python). The data are stored in Amazon Web Services S3 buckets to facilitate cloud-based analyses.
The data are indexed in Amazon’s Elasticsearch to enable the use of APIs to instantly search results and produce COVID-data visualizations on the dashboard with Apache E-charts and Leaflet map.
Current Status
SeroHub now includes results from more than 127 studies conducted in all 50 states (as well as Washington, D.C., and U.S. territories) with 34,367 seroprevalence estimates. Another 63 studies are currently undergoing the process for inclusion. Since December 2020, SeroHub has had been visited more than 780,040 times, with most users from the United States, Canada, France, and the United Kingdom. Currently, SeroHub averages 39,000 visits per month.
Next Steps
As we’ve now completed our first full year of operation, we’ve had a chance to look back at the lessons learned along the way in the launch of this unique resource. As might be expected, timeliness remains an ongoing challenge. Even the most expedient studies experience a lag time from the conclusion of the study to publication of the results. Including pre-print articles has helped address some of this delay but timeliness remains a challenge. Furthermore, because SeroHub is manually curated, there’s also a delay between time of publication and posting on the website.
Now in our second year of tracking COVID seroprevalence, new challenges have emerged. Substantial differences in vaccine-induced and infection-induced immunity can be found throughout the nation and vary by vital demographic factors. Rapidly emerging variants, such as omicron, suggest that it is not just seropositivity “yes or no” that’s important, but also the level of antibodies in the blood. As seroprevalence studies evolve to address new research questions, we will adapt SeroHub to collect and display these necessary data.
Monitoring seroprevalence is as essential today as when the pandemic first began. Not only can we distinguish vaccine-induced from infection-induced immunity, we can also identity populations at particular risk. Such information will help us identify and target public health efforts.
In addition, moving forward, SeroHub offers valuable information for the future. The infrastructure used in developing this tool, and the processes we’ve created, will serve as a blueprint for monitoring future infectious disease outbreaks that threaten public health.
For more information and to explore how the prevalence of SARS-CoV-2 has varied over the course of the pandemic, as well as how seroprevalence continues to differ by geographic region and population, visit the SeroHub website.
Categories
- Data Sharing (66)
- Informatics Tools (42)
- Training (40)
- Precision Medicine (36)
- Data Standards (36)
- Genomics (36)
- Data Commons (34)
- Data Sets (27)
- Machine Learning (25)
- Artificial Intelligence (25)
- Seminar Series (22)
- Leadership Updates (14)
- Imaging (13)
- Policy (10)
- High-Performance Computing (HPC) (9)
- Jobs & Fellowships (7)
- Semantics (6)
- Funding (6)
- Proteomics (5)
- Information Technology (4)
- Awards & Recognition (3)
- Publications (2)
- Request for Information (2)
- Childhood Cancer Data Initiative (1)
Leave a Reply