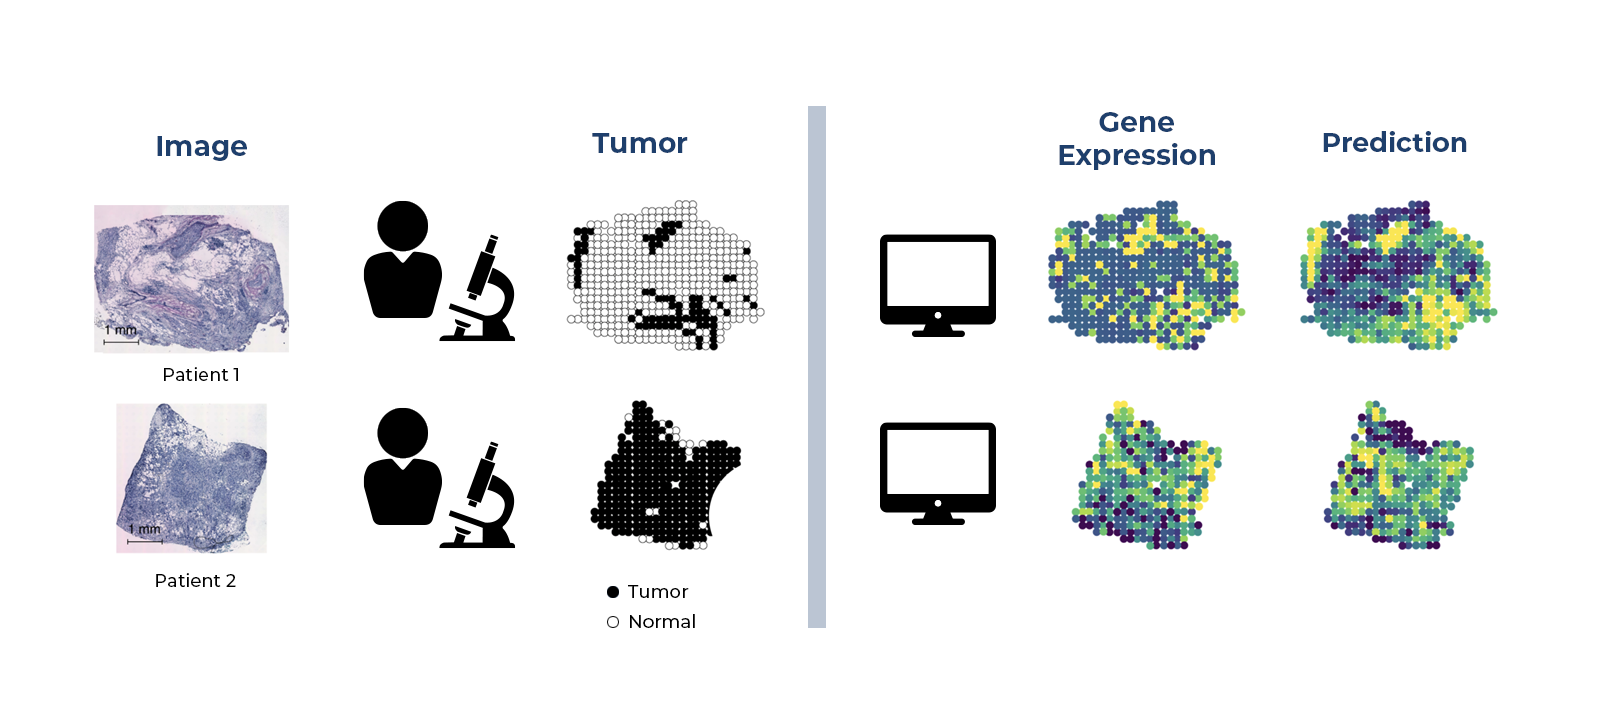
Figure 1. (click to enlarge) Illustration that depicts the diagnosis of two separate patients. The black-and-white tumor illustration (left) shows the annotations made by a pathologist based on her best interpretation of what parts of the tissue sample were normal and what parts were diseased. The “gene expression” column (right) shows how a computer algorithm (called ST-Net) not only mimicked what the pathologist recorded, but it also allowed researchers to map known breast cancer genes onto the tumor sample itself. The result (shown in the “prediction” column) gives a more detailed picture of the tumor, its genes, and how it might progress. This opens new areas for intervening to silence those genes or gene products and gives clinicians more information for targeting treatment with greater precision.